Record Breaking Start To The Year For Ealing Property
Highest price paid ever paid for apartment in Dickens Yard
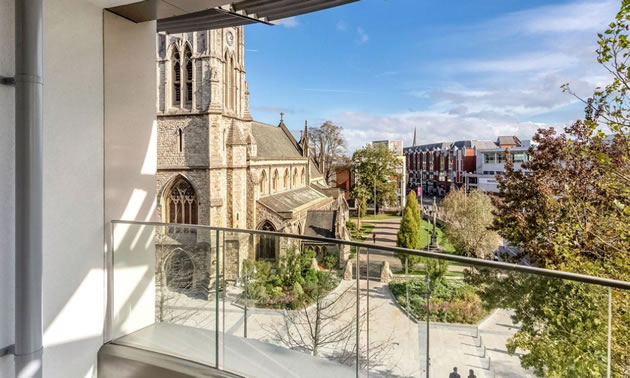
The unit in Dickens Yard is understood to have exceptional views
The Ealing property market seems to have made a strong start to the year with the average price paid in the W5 area reaching an all-time high and some record breaking sales taking place.
The highest price ever for a newly built flat has been paid with £3,500,000 being laid out for a double unit in Quartz House in Dickens Yard. It is understood that the property enjoys panoramic across London.
There has also been a continuation of relatively strong demand for larger family houses in the area with several transaction in the £2million plus bracket and a house in Tring Avenue selling for £3,500,000. This house has seven double bedrooms and a 225 foot garden (see below) and changed hands for the sixth highest price ever paid for a residential property in the W5 postcode area.
These sales have resulted in the average price in Ealing W5 reaching an all-time high of £905,348 in the first quarter up by 21.6% over the past year. However, this rise reflects more the changing make up of the type of property selling rather than a general increase across the market. Sales volumes for flats have collapsed boosting the average artificially. Over the last year the average price of a terraced house in the area has actually fallen and flat prices are only up marginally.
| Ealing W5 Post Code Area Property Prices - (January - March 2019) | ||||||||||
|---|---|---|---|---|---|---|---|---|---|---|
Area |
Detached |
Sales |
Semi-detached |
Sales |
Terraced |
Sales |
Flat/ |
Sales |
Overall Ave |
Overall Sales |
| W5 1 | 0 | 0 | 795000 | 2 | 836250 | 4 | 509529 | 4 | 697312 | 10 |
| W5 2 | 2291667 | 3 | 0 | 0 | 560000 | 1 | 868333 | 9 | 1173077 | 13 |
| W5 3 | 2790000 | 2 | 1252000 | 5 | 1290000 | 1 | 502500 | 4 | 1261667 | 12 |
| W5 4 | 0 | 0 | 658200 | 5 | 709175 | 6 | 426250 | 6 | 594326 | 17 |
| W5 5 | 0 | 0 | 1218333 | 3 | 0 | 0 | 462833 | 3 | 840583 | 6 |
| Total | 2491000 | 5 | 986400 | 15 | 787504 | 12 | 608043 | 26 | 905348 | 58 |
| Change in Quarter | 43.5% | -37.5% | 11.9% | -6.3% | 12.5% | -62.5% | 7.9% | -59.4% | 25.7% | -51.7% |
| Change in year | 79.6% | -28.6% | 7.7% | -11.8% | -8.4% | -57.1% | 3.8% | -61.2% | 21.6% | -51.3% |
| Change in three years | 23.8% | -68.8% | -12.0% | -25.0% | -2.5% | -76.0% | 16.9% | -80.0% | 20.3% | -73.1% |
| Change in five years | 66.3% | -44.4% | 10.4% | -25.0% | 11.8% | -76.0% | 68.3% | -72.3% | 55.8% | -66.5% |
| Change in ten years | - | - | 181.8% | 400.0% | 107.6% | -7.7% | 130.1% | 30.0% | 189.3% | 61.1% |
The information released recently by the Land Registry is giving no indication of any sales taking in the Filmworks development in central Ealing. Only two sales of new build units in W5 were recorded during the first quarter of the year including the record sale of the double unit in Dickens Yard.
We have previously asked St George's why no sales were being recorded and they told us, "We do not confirm the number of sales for developments across our portfolio, however since the launch of the Filmworks development in 2018 we have enjoyed significant interest which is a reflection of the high quality design of the homes and public realm."
They unveiled latest phase of the development, Chapman House in April.
When we asked agents in the area whey no sales were yet being registered, they suggested that it could be because the units are available to be reserved only at the moment and not being transacted as a full sale. However it was felt that it would be challenging to market the units as they would be above the £450,000 to qualify for Help To Buy support from the government.
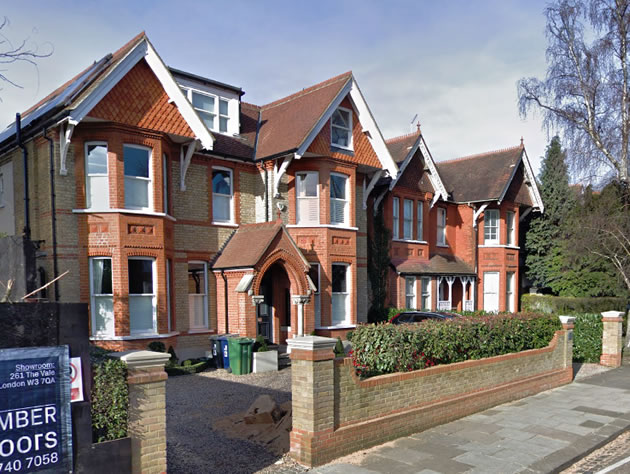
House on Tring Avenue sold for £3,500,000. Picture: Google Streetview
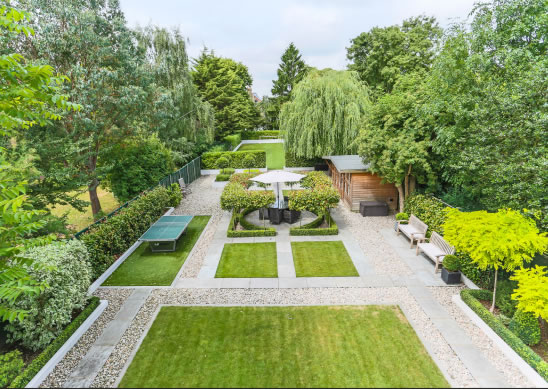
Garden of Tring Avenue house is 225ft
Prices appear to have also surged in the West Ealing area with a 19.4% increase over the quarter to £723,215 but, as in W5, this rise is entirely down to a blip in the number of larger houses being sold during the period and a sharper fall in turnover of flats. The average price of a terraced house and a flat in the W13 post code area has remained broadly unchanged.
| Ealing W13 Post Code Area Property Prices - (January - March 2019) | ||||||||||
|---|---|---|---|---|---|---|---|---|---|---|
Area |
Detached |
Sales |
Semi-detached |
Sales |
Terraced |
Sales |
Flat/ |
Sales |
Overall Ave |
Overall Sales |
| W13 0 | 0 | 0 | 802857 | 7 | 681175 | 4 | 302125 | 4 | 636880 | 15 |
| W13 8 | 2195000 | 1 | 1622500 | 2 | 785000 | 3 | 365714 | 7 | 796538 | 13 |
| W13 9 | 0 | 0 | 966917 | 6 | 749375 | 12 | 484167 | 6 | 737458 | 24 |
| Total | 2195000 | 1 | 977767 | 15 | 740642 | 19 | 392559 | 17 | 723215 | 52 |
| Change in Quarter | - | - | 20.3% | 114.3% | 0.1% | -5.0% | -1.9% | -34.6% | 19.4% | -5.5% |
| Change in year | - | - | -7.4% | 36.4% | 4.4% | -20.8% | -1.8% | -50.0% | 11.6% | -26.8% |
| Change in three years | - | - | -8.8% | -21.1% | 3.8% | -47.2% | -11.1% | -74.2% | 13.3% | -58.1% |
| Change in five years | - | - | 27.8% | -16.7% | 18.6% | -52.5% | 18.2% | -58.5% | 29.6% | -49.0% |
| Change in ten years | - | - | 66.5% | 87.5% | 109.8% | 46.2% | 82.0% | 142.9% | 87.6% | 85.7% |
Source: Land Registry
Although things may seem gloomy at the moment, in the same period ten years ago we were in the grip of the financial crises and activity in the property market, even at currently depressed levels, is much higher than it was at the beginning of 2009.

The Nationwide’s House Price Index showed that London had the fastest pace of decline in the UK in the first quarter of 2019 with prices down by 3.8% compared with the same period in 2018 averaging £455,594. This is the steepest fall for the area since 2009 and the seventh consecutive quarter in which prices have declined. The Nationwide’s analysts say this partly reflects the level of price outperformance previously seen in the capital and the impact of policy changes on the Buy to Let market which has had a bigger effect on London because the private rental sector accounts for a larger proportion of the housing stock than elsewhere in the country.
Commenting on the figures, Robert Gardner, Nationwide's Chief Economist, said, “UK house price growth remained subdued in March, with prices just 0.7% higher than the same month last year.
“Indicators of housing market activity, such as the number of property transactions and the number of mortgages approved for house purchase, have remained broadly stable in recent months, even though survey data suggests that sentiment has softened.
“Measures of consumer confidence weakened around the turn of the year and surveyors report that new buyer enquiries have continued to decline, falling to their lowest level since 2008 in February.”
The March 2019 RICS UK Residential Survey results show little departure from the subdued picture evident across the sales market for several months now. They say forward looking indicators suggest this lack of momentum is likely to continue for a while longer, although perceptions on the twelve month outlook are a little more sanguine. However London and the South East continue to display the weakest sentiment in terms of prices.
May 9, 2019